Opening the order list in an internal business system delivered six months ago takes 15 seconds. Detail pages open instantly. CSV exports are fast. Only the list page is slow, and performance worsens as data accumulates.
When requesting maintenance, you were told that "the server lacks adequate specifications," but scaling it up produced virtually no change. Many project stakeholders have experienced this exact frustration.
The reason hardware upgrades fail is clear: the issue is not that individual executions are heavy, but that executions happen too many times. This type of latency can be diagnosed simply by counting issued SQL statements. Even without specialized technical knowledge, observing how query volume scales points directly to the cause.
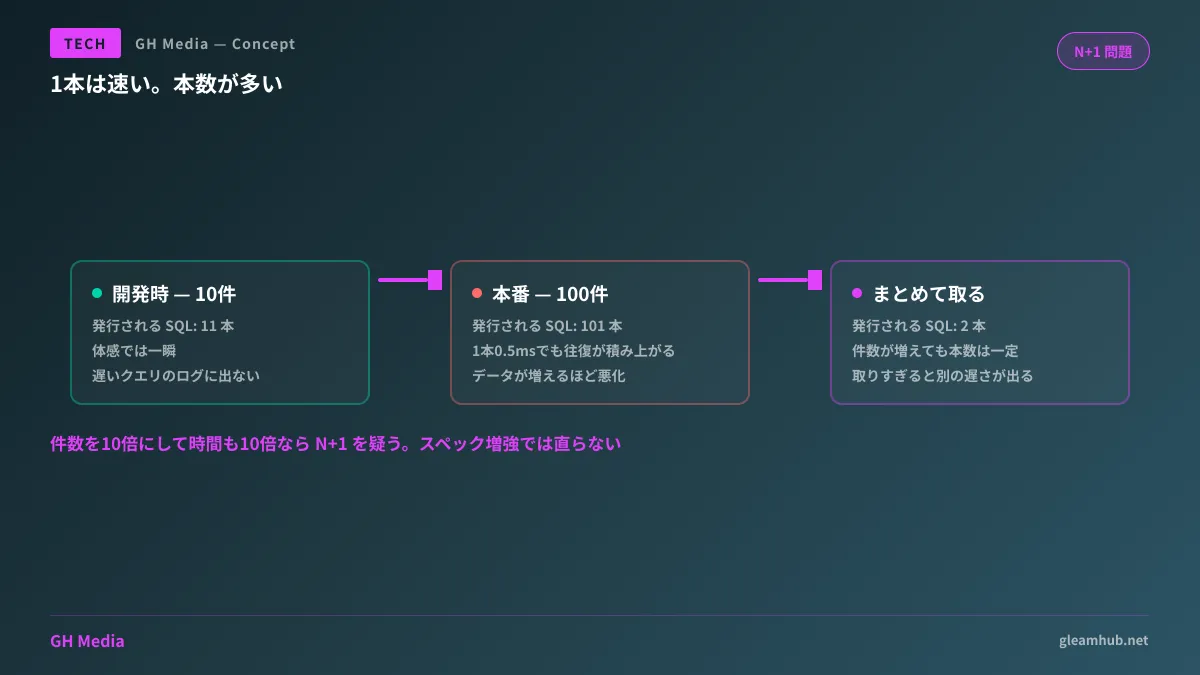
Displaying 100 items triggers 101 SQL queries
Consider a classic example: a view displaying a list of articles along with each author's name.
# 1本目: 記事を100件取得する
articles = session.query(Article).limit(100).all()

for article in articles:
    # ループのたびに著者を1件取りに行く → ここで100本
    print(article.author.name)
At a glance, this code looks like a single data retrieval operation. In reality, it issues 101 SQL queries. The initial query retrieves 100 articles, followed by 100 additional queries sent one by one to fetch each author. Because it follows an "N records + 1 query" pattern, it is called the N+1 problem.
What makes this insidious is that each individual SQL query is fast. If each completes in 0.5 milliseconds, slow query logs catch nothing. But when 101 queries queue up sequentially, accumulated round-trip network latency adds up to several seconds. During development, testing with only 10 records generates just 11 queries, going unnoticed by everyone. It surfaces only when data grows due to this exact architecture.
Diagnosis clients can perform themselves
You can verify whether N+1 is the culprit without reading code: simply change the display limit and observe how response time responds.
- Set the list display limit to 10 items and time how long it takes to open
- Set the same page to 100 items and time it again
- Compare how execution time scales
If scaling the item count by 10x increases loading time roughly 10x, suspect an N+1 issue. Normally, increasing the displayed count merely increases payload size without changing the number of round-trip network requests. When latency scales linearly with item count, something is almost certainly repeating for every single record.
The question to ask your maintenance provider is not "Is it slow?" but "How many SQL queries are issued on this screen?" Phrasing it this way elicits numbers rather than impressions. Most web frameworks have mechanisms to log executed SQL statements, making it straightforward to report exact counts.
The fix: fetching in batches
The remedy is to stop fetching records one by one inside a loop and instead retrieve them in batches. In the earlier code, this means instructing the ORM to eager-load related data upfront.
from sqlalchemy.orm import selectinload

articles = (
    session.query(Article)
    .options(selectinload(Article.author))  # 著者をまとめて取る
    .limit(100)
    .all()
)

for article in articles:
    print(article.author.name)  # 追加のSQLは出ない
This collapses 101 queries down to two: one to fetch articles, and one to batch-fetch the necessary authors. Another approach uses a JOIN to fetch everything in a single query; which pattern is faster depends on data structures.
While this example uses Python's SQLAlchemy, the underlying mechanics remain identical across ORMs. Rails, Laravel, Prisma, and TypeORM all offer equivalent eager-loading mechanisms. If you are evaluating ORM selection itself, Evaluating Migrations Between Drizzle ORM and Prisma and Choosing Between TypeORM 1.0 and Legacy ORMs provide helpful guidance.
Avoiding new bottlenecks while fixing the issue
Modifications can introduce side effects when taken too far.
Over-fetching creating a different bottleneck
Instructing the ORM to load all related data together can lead to massive JOINs pulling unnecessary data. If queries retrieve fields never displayed on the list, query counts may drop while data transfer balloons, causing new latency. When receiving reports that "the N+1 issue was eliminated," verify both query counts and total response time.
Masking the issue with caching
If performance was improved merely by reusing cached results, it creates a new bug where stale data displays immediately after an update. It is worth asking whether speed gains stem from caching or an actual reduction in query counts.
To continuously evaluate whether fixes are effective, benchmarking under load is essential. Implementation steps are covered in Load Testing and Performance Guarantees with k6, and tracing production latency is detailed in Investigating Performance Through Trace Analysis.
Documenting in acceptance criteria
When this issue surfaces post-delivery, it frequently leads to debates over change orders. Because it does not reproduce with development-scale data, acceptance testing fails to catch it. Establishing explicit requirements during contracting is the most cost-effective solution.
Express criteria measurably rather than using subjective phrases like "fast rendering."
- Measure response times on primary list views with production-equivalent record counts loaded
- Ensure response time does not increase proportionally to item count when display limits increase tenfold
- Submit counts of SQL statements issued across primary views
The third criterion is especially effective. When vendors know query counts will be submitted, engineers notice problems during implementation. This saves both parties effort compared to discovering and refactoring issues during acceptance testing.
What to do next
Pick the slowest list screen in your currently operating system. Adjust the display limit and see if loading time scales proportionally. That simple check alone will clarify whether spending money on infrastructure upgrades makes sense.
If latency scales proportionally, server upgrades will not resolve it. Informing your maintenance team that "it slows down in proportion to item count" rather than just saying "it's slow" gives them immediate diagnostic direction.
GleamHub provides support for existing system performance audits and designing acceptance criteria for new projects through our Development, AI, and Automation Consultations. Because root cause isolation depends on system architecture and data volume, please consult with us individually. Feel free to reach out via Contact Us.