"The business system gets slow in the afternoon." For maintenance providers, this is the most troublesome type of report to receive.
No errors appear. Logs show nothing unusual. Performing the same actions in dev environments fails to reproduce the issue. In the end, teams respond with "let's monitor it," only to receive the exact same complaint the following month. Performance issues are often neglected not because they are unfixable, but because the path to discovering the root cause is overwhelmingly burdensome.
For Windows applications, capturing a trace is not particularly difficult. The bottleneck comes right after. Opening captured traces in Windows Performance Analyzer (WPA) reveals a dizzying array of graphs and data tables. Only a few engineers in any company understand which tables to inspect and which call stacks indicate problems. If those individuals are tied up with other projects, investigations stall.
Querying traces in natural language
Microsoft addressed this interpretation bottleneck with an early preview of Windows Performance Analyzer MCP (WPA MCP) (Introducing WPA MCP — Microsoft Performance and Diagnostics Blog).
By connecting GitHub Copilot CLI to WPA's trace analysis workflow, it lets developers query trace contents using natural language instead of manually navigating graphs and tables.
It enables three primary capabilities:
- Initiate investigations with plain-language queries such as "What was consuming CPU during this timeframe?"
- Reach relevant WPA tables and graphs much faster
- Isolate sources of issues like heavy CPU activity, deep call stacks, and input lag
The current early preview only supports GitHub Copilot, requiring an active Copilot subscription. Concurrently, Microsoft is developing ETW MCP for similar analysis against Event Trace Log (ETL) files. Microsoft positions these two tools as complementary: WPA MCP for developers who want visual confirmation of traces, and ETW MCP for automated pipelines.
Impact lies in the entry point, not the analysis itself
Overinflating expectations for tools like this leads to disappointment. AI does not definitively pinpoint root causes on its own. Interpreting traces requires system-specific context—such as nightly batch processing windows, antivirus scanning configurations, and shared storage architecture. That is context the AI lacks.
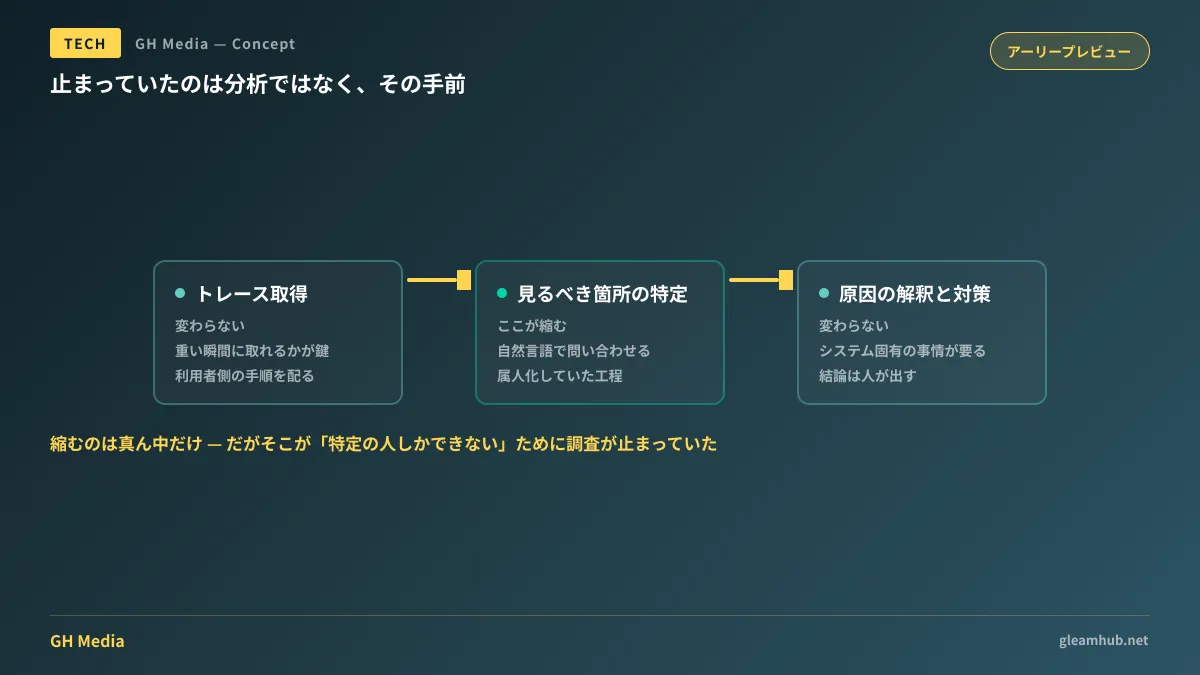
What changes, then? The time required to reach the starting point of an investigation.
| Process | Traditional | With MCP |
|---|---|---|
| Trace capture | Unchanged | Unchanged |
| Pinpointing where to look | Several hours by WPA specialists | Narrowed down via natural-language queries |
| Interpreting causes and countermeasures | Unchanged (human judgment) | Unchanged (human judgment) |
Thinking of it as shrinking only the middle row accurately reflects reality. However, because that middle row was precisely where investigations stalled due to relying on specialized staff, the impact is substantial.
Defining capture conditions when including it in maintenance agreements
If you outsource maintenance and want to capitalize on this shift, one agreement must be locked down before tooling adoption: when to capture traces.
Trying to capture a trace after a sluggishness report arrives usually means the issue has already passed. The effective alternative is setting up the system so users themselves can trigger trace capture the moment they experience slowdowns. Packaging capture steps into a single desktop shortcut eliminates back-and-forth cycles waiting for issues to reappear.
From there, codifying two points in maintenance agreements ensures smooth ongoing operations:
- What conditions trigger an active investigation upon performance reports (e.g., an attached trace file)
- How to treat investigations concluding that "the issue was not application-side" (such as the extent of reporting on endpoint and network observations)
The second point is frequently overlooked, yet performance investigations often trace back to issues outside application code. Without this agreed upon, engineering efforts conclude without deliverable credit.
For similar root-cause isolations, exploring cases where latency stemmed from inter-region calls and architectures continuously monitoring latency via continuous profiling provides helpful context. For the mechanics of MCP itself, consult our Complete Guide to MCP.
Whether to try it now
Given that it is an early preview requiring a Copilot subscription and focuses on Windows trace formats, it is not something to deploy company-wide immediately.
Conversely, if you maintain Windows enterprise systems and regularly spend hours dealing with performance complaints, testing it is decidedly worthwhile. The trial costs are low, and the immediate benefits are clear.
To begin, select a recent unresolved issue where users reported slowness, and try capturing a trace for it. Success resolves the ticket directly; failure still provides valuable insight to refine your subsequent investigation playbook.
GleamHub provides guidance on diagnosing enterprise system performance and structuring maintenance workflows through our custom development, AI, and automation consultations. Recommended procedures differ by system architecture and usage patterns, so we provide custom estimates. Please contact us via our Contact Us page.
Sources
- Introducing WPA MCP: Early Preview of AI-assisted trace analysis in Windows Performance Analyzer — Microsoft Performance and Diagnostics Blog
- Microsoft Previews "Windows Performance Analyzer MCP": AI Analyzes Trace Logs to Diagnose Sluggish Apps — Publickey
- Windows Performance Analyzer — Microsoft Learn
- Model Context Protocol