You open the ad dashboard and conversions are up on last month. The cost per conversion is down too. And yet the number of deals reaching sales has not grown. Revenue at month end has not moved either. For the side paying for the ads, this is the most unsettling state to be in.
Ask the agency and you are told "we are getting conversions", and the numbers do say exactly that. But there are cases where what those numbers point at and what the business needs have diverged.
In September 2026, a game developer reported on their own blog that after spending about 220 dollars on Google app ads, roughly 60% of the installs they received came from bots. It is a small-scale investigation by an individual developer, not a figure Google has confirmed. The process by which they told the difference, however, is shaped so that any business paying for ads can apply it.
What was being recorded as a conversion
According to the report, the unnatural installs shared a common pattern. They would pick the shortest video in the ad group and watch it, then install the app not from the app store but from a saved copy of the file. The explanation given is that avoiding the store route is faster and less likely to be noticed by the store.
And when a video view and an install occur back to back, the ad side counts it as a conversion. Seen from the platform's dashboard, it becomes a record of a result delivered normally.
The developer noticed this because they were looking at behavior inside the app rather than at the ad numbers. Leaving immediately after installing without doing anything, extremely short session times, never launching it again the next day or after. Because these behaviors clustered in particular traffic sources, they could be told apart.
The dashboard alone cannot show it, structurally
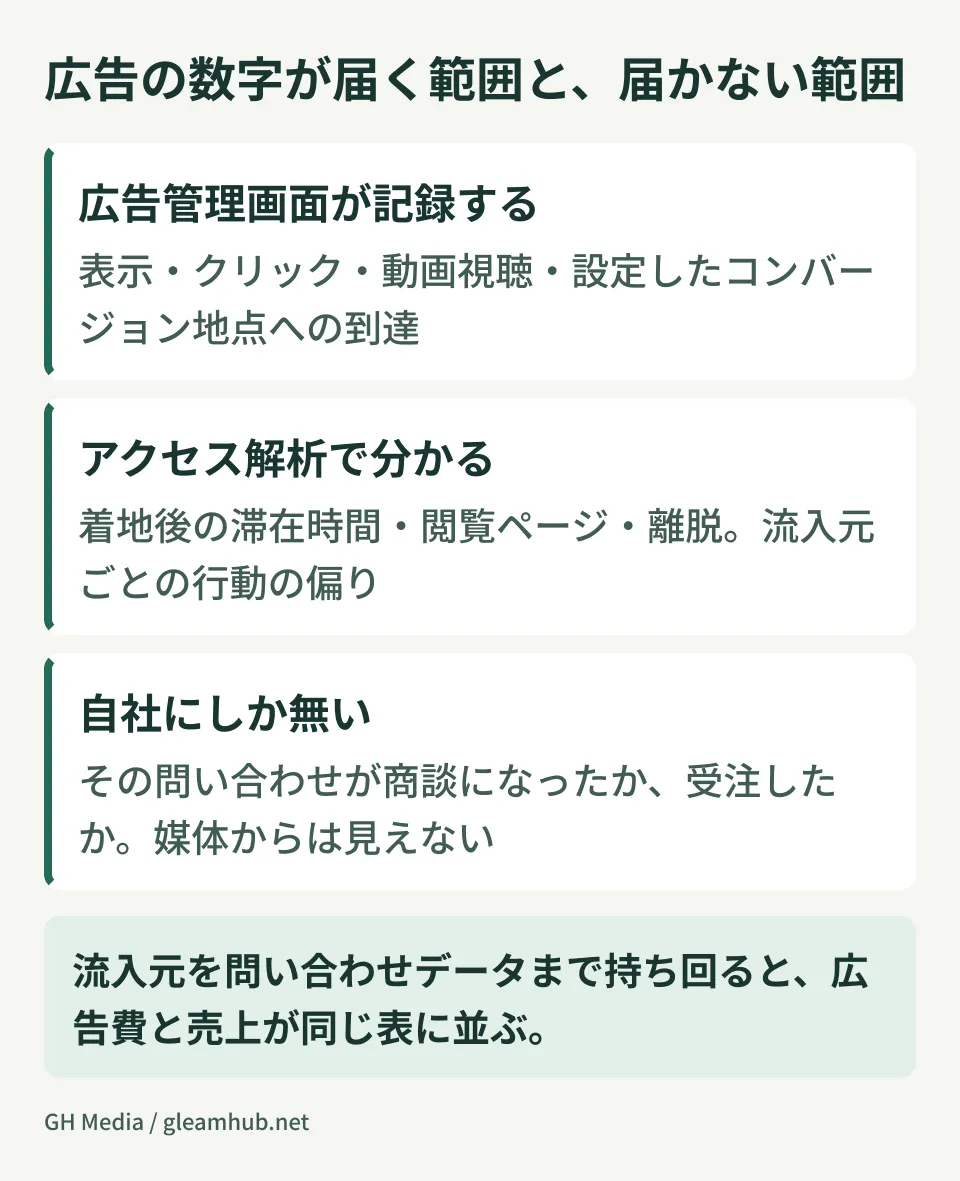
This is the important part. An ad platform's dashboard displays only events within the range the platform can measure. It was clicked, the video was viewed, the conversion point you configured was reached. Up to here it is recorded accurately.
What is not recorded is what comes after. The fact that an enquiry form was submitted remains, but whether that enquiry became a deal is not something the platform can know. Even when the signal the platform is optimizing against has diverged from the business outcome, it looks normal from the platform.
This is not limited to bots. On a B2B site with "download our materials" set as the conversion, submissions from competitors and from salespeople are counted as the same single event. Because the platform learns in the direction of increasing that event, the result can be that the longer you run it, the more sales email you get.
A procedure you can run on your own ad spend
Before bringing in an external tool, there are checks you can make with what you already have. They work in this order.
1. Look at behavior after the conversion. In your analytics, look at session time and pages viewed for visitors who converted, broken down by traffic source. Even for the same enquiry, someone who browsed the site for five minutes before submitting and someone who submitted seconds after landing are not the same. If the latter cluster in a particular campaign, start looking there.
2. Match the content of the form against the traffic source. Give the enquiry form a hidden field that records which route the visitor came from. Look at three months together and which campaigns' enquiries are becoming deals emerges as fact. This is information the platform side can never know.
3. Look at the distribution by time of day and region. If conversions outside business hours, or from regions outside your service area, are unnaturally frequent, your exclusion settings may be loose. Whether the source is human or automated, it shows up here as the same kind of skew.
| Inspection area | What you can learn | What it cannot tell you |
|---|---|---|
| Ad dashboard | Clicks, impressions, conversion count and cost per conversion | Whether the business moved beyond that point |
| Analytics | Behavior after landing, session time, exits | Who an enquiry came from |
| Your own deal records | The route that led to an order | The placements on the platform |
As long as you look at the three separately, the divergence stays hidden. Only when you design things to carry the traffic source information through into the enquiry data do ad spend and revenue line up in the same table.
What you can rely on the platform for, and what you cannot
Each platform runs detection for invalid clicks and traffic, and there are mechanisms that deduct clearly fraudulent activity from your costs. This works. It is the part you can rely on.
What you cannot rely on is results that are technically normal but worthless to the business. If a real human clicks the ad and submits the form, but did so for sales purposes, nothing looks abnormal from the platform. This is the layer that commonly erodes small and medium businesses' advertising.
As a countermeasure, moving the conversion point closer to the business outcome works better than expanding exclusion lists. Instead of form submissions, feed the number of deals created back to the ad side. Even if that is not immediately feasible, simply reconciling by hand each month changes which campaigns you keep and which you drop.
The thinking behind ad spend itself is laid out in the guide to search advertising cost ranges, and budget design for Google Ads in the guide to Google Ads costs.
What to do next
First, count how many of your conversions over the last three months actually led to a deal or an order. Set that against the conversion count in the ad dashboard, and if the proportion is under ten percent, what you are currently optimizing may not be the business outcome.
Then add a field to your enquiry form that records the traffic source. Without it in place, you will not be able to make this same judgement over the next three months either.
At GleamHub we take enquiries about advertising operations and web marketing. Beyond improving the delivery itself, we can help from the point of designing what counts as a conversion. The right measurement point varies with the shape of the business, so start by telling us where things stand. You can get in touch via Contact.