The Claude calls built into an internal system became slow one day. With application logs alone, it is hard to isolate which request in which feature is taking time, or whether it is stuck on a tool call. You end up looking at the bill that arrives at the end of the month and searching after the fact for which features are using tokens.
On October 14, 2026, the Claude Platform release notes announced a feature (beta) that exports Messages API requests and Claude Managed Agents sessions as OpenTelemetry traces. They can be sent directly to any monitoring platform that accepts OTLP, such as Datadog, Grafana Cloud, New Relic and Sentry.
While convenient, depending on the settings, the full text of prompts and responses will be stored in an external monitoring service. In this article, based on the official documentation and the results of running the TypeScript SDK in our test environment, we lay out what to decide before integrating it.
SDK traces and API traces are different things
The official documentation (OpenTelemetry for the Claude API) divides tracing into two approaches.
- SDK traces: The Claude SDK creates spans inside your application, and they are sent through your application's OpenTelemetry setup. Configuration is done in code and requires no special permissions
- API traces: Anthropic creates the spans and sends them directly to a destination registered in the Claude Console. Registration requires the organization's admin role
Some things are visible only in API traces: how many times the model ran within a single request, server-side tools such as web search, and Managed Agents turns. Conversely, client-side tools executed by the SDK's tool runner and non-Messages requests such as file uploads appear only in SDK traces. If you configure both, spans from both appear side by side within a single trace.
One thing to watch is which environments support API traces. According to the table in the documentation, only Claude Platform and Claude Platform on AWS are supported. If you use Claude via Amazon Bedrock or Google Cloud's Vertex AI, only SDK traces are available.
Decision 1: whether to send prompts and responses
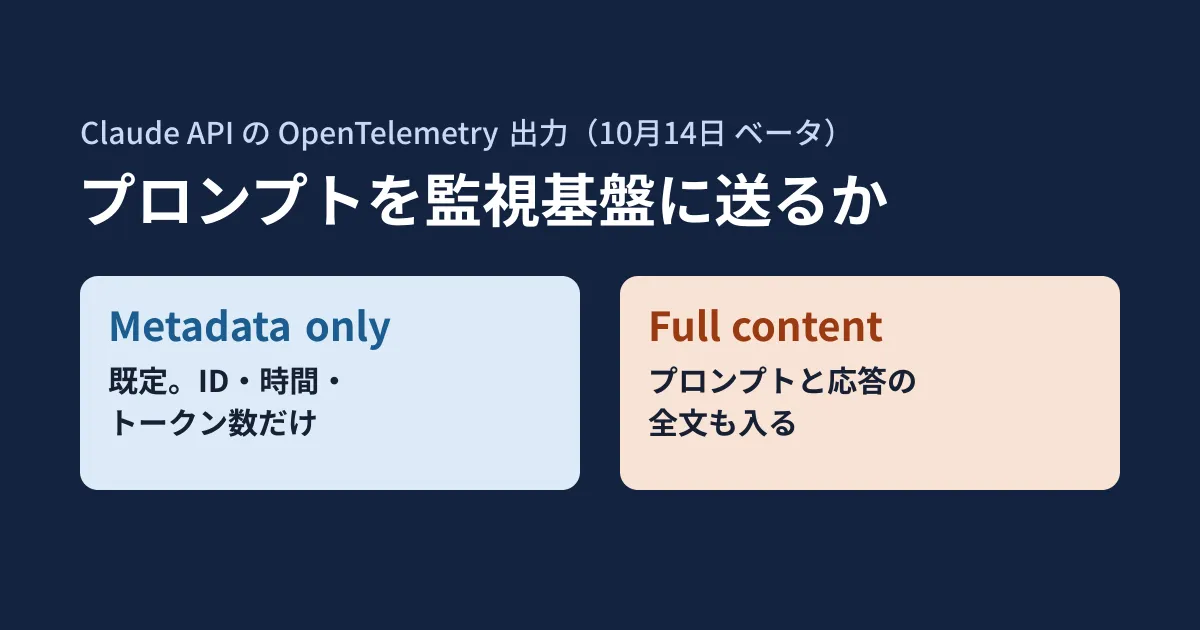
Destinations and SDK clients each have a "content mode."
- Metadata only (
metadata_onlyin the SDK): The default. Includes IDs, timings, status, token counts and so on - Full content (
contentin the SDK): In addition to the Metadata only content, includes the full text of prompts and responses
The documentation warns that with Full content, the monitoring service you send to stores the content according to its own access permissions and retention settings. For processes that put customer inquiries or internal documents into prompts, anyone with view access to the monitoring service will be able to read the full text.
In our test environment, we used TypeScript SDK 0.134.0 to send requests to a locally hosted stub server (one that returns fixed responses in the Messages API format) and examined the attributes of the spans the SDK creates. We placed a marker string in the prompt and compared the two modes.
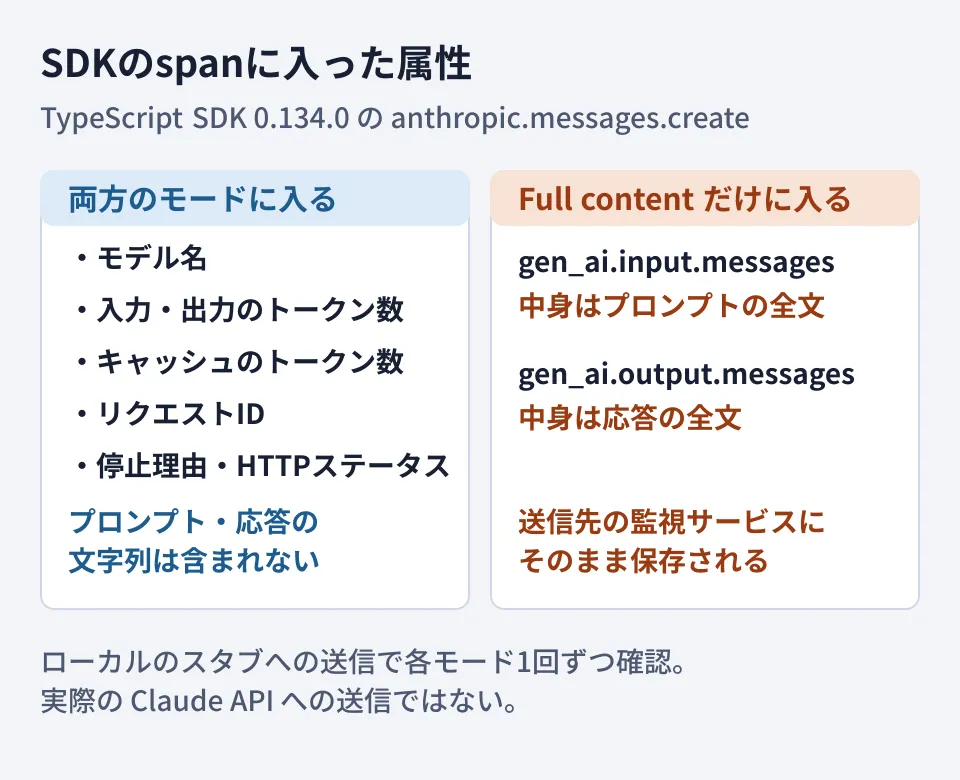
The Metadata only span contained 20 attributes, including the model name (gen_ai.request.model), input, output and cache token counts (gen_ai.usage.*), request ID (anthropic.request.id), stop reason and HTTP status, and included neither the prompt string nor the response string. With Full content, two attributes, gen_ai.input.messages and gen_ai.output.messages, were added, containing both strings. According to the documentation, with Full content the system prompt is also included in gen_ai.system_instructions (this attribute did not appear in the output of our test).
Based on these results, we suggest the following order.
- Start with Metadata only and watch trends in latency, error rates and token counts
- If you need the content to investigate a cause, set up a destination separate from production with Full content, and use it only for test workspaces
- If you use Full content in production, decide the view permissions and retention period on the monitoring service side first
Note that if your organization has data handling restrictions for HIPAA, FERPA or K-12 data, API destinations are Metadata only regardless of settings (SDK spans are not covered). Full content can be used even under a zero data retention (ZDR) agreement, and the documentation states that Messages API content is held only in memory until it is delivered to the destination.
Do not put personal information in conversation IDs
The SDK has conversation_id (conversationId in TypeScript), which groups multiple calls into a single conversation. The documentation states, "The ID is exported in both content modes, so don’t put personal data or secrets in it." Because it is sent even in Metadata only mode, do not put email addresses or membership numbers in it as is; use a separate ID that can be looked up internally.
Decision 2: where to count tokens
Because traces include token counts, it is tempting to use them to aggregate usage by feature. However, the "Counting tokens" section of the documentation lists rules to avoid double counting.
- For requests that have both SDK and API traces, sum only the API-side spans. Both are named
anthropic.messages.create; the SDK side has kindCLIENTand the API side has kindSERVER - On the API side, sum only one of
anthropic.messages.createor theanthropic.model_requestspans beneath it gen_ai.usage.input_tokensalready includes cache read and write tokens
In addition, delivery is "At least once" (the same span may arrive more than once) and "Best effort" (spans may be lost without arriving). The documentation states that traces are not a complete record of API usage and recommends using the Usage API to track usage per API key.
In our view, the safe approach is to split roles: traces for investigating latency and causes, and the Usage API for reconciling billing. If you sum token counts on a dashboard, deduplicate by trace ID and span ID, and fix the names and kinds of the spans you sum.
Decision 3: destinations and scope
Destinations for API traces have the following requirements (from "What you need," "Delivery and health" and "Limits" in Set up API tracing).
| Item | Condition |
|---|---|
| Endpoint | OTLP/HTTP (protobuf), HTTPS on port 443. The URL must use a hostname, not an IP address |
| Conditions that stop delivery | Returning a 3xx redirect, the hostname resolving to a non-public IP address, or all deliveries failing for 24 hours |
| Response latency | The TLS handshake and response headers must each complete within 5 seconds, and a single delivery is limited to 10 seconds in total |
| Limit | 10 destinations per organization (including disabled ones) |
If you receive traces with your own OpenTelemetry Collector, the OTLP/HTTP endpoint defaults to port 4318. The documentation says to either configure it to accept HTTPS on port 443 or put a load balancer or reverse proxy in front of it. A Collector that exists only inside your internal network cannot receive traces as is.
The scope of what is sent can be chosen per workspace (all, selected, or all except selected). If you separate workspaces by production, testing and department, you can split things so that only production goes to a Metadata only destination and only testing goes to a Full content destination.
Connecting to your own traces
By default, API-side spans form an independent trace. To place them under your application's trace, configure SDK tracing and call the SDK from within your own span. The API reads the link from the W3C traceparent header. In our test as well, the SDK attached a traceparent header to requests to the stub server.
For requests where the header's sampled flag is off, no API-side spans are created. If you lower the sampling rate, API-side traces decrease accordingly.
Checklist before integrating
Summarizing the above as items to check before integration, we arrive at the following.
- Confirm the route you use. Is it the Claude API directly, Claude Platform on AWS, or Bedrock or Vertex AI? The latter two support SDK traces only
- Upgrade and pin the SDK version. The
openTelemetryoption was added to the TypeScript SDK in 0.134.0 (published to npm on October 14, 2026, UTC) and is not included in 0.133.0. The documentation advises pinning the version because span and attribute names may change during the beta - Decide the content mode for each destination. Start with the default, Metadata only
- Decide what value to put in
conversation_id. Do not include personal or confidential information - Decide who registers destinations. The admin role is required. Even if you delegate to an external development company, decide who manages the monitoring service API key placed in the destination's headers
- Decide how to aggregate token counts. Fix which spans to sum and how to deduplicate, and reconcile billing with the Usage API
Designing for collecting AI calls in an external monitoring platform can be approached as an extension of existing application monitoring. We cover how to think about migrating to OpenTelemetry in OpenTelemetry migration through the Airbnb case, designs for managing calls to multiple AI services in one place in our article on AI gateways, and how model price cuts translate into your bill in A cheaper new model does not automatically lower your bill.
Scope of verification
On October 15, 2026, we directly retrieved and reviewed the Claude Platform release notes and the OpenTelemetry documentation (overview, Set up API tracing, Set up SDK tracing) (document research). On October 16, 2026, before publication, we retrieved the same materials again and cross-checked the text. In addition, in our test environment (Linux, Node.js v22.22.0,
@anthropic-ai/sdk0.134.0,@opentelemetry/sdk-trace-node2.12.0), we collected SDK spans in memory against a local stub server and checked the attributes once in each content mode (hands-on testing; this did not send requests to the actual Claude API). We did not check destination registration in the Claude Console, API-side spans, display in monitoring services, or SDKs in other languages such as Python.
For designing monitoring of internal systems that integrate the Claude API, or deciding how to handle logs of AI calls, please contact us through consultation on development, AI, and automation.