The images are compressed. The JavaScript has been cut down. Yet people still say the first page takes too long to appear. When improving display speed, the measures sometimes focus entirely on the frontend. The places you worked on were the right ones, but the remaining slowness lives somewhere else.
Measurements that Cloudflare published in September 2026 show one of those places in concrete numbers. What tends to be overlooked is not the page content but the first round trip when communication begins.
A wrong key exchange guess adds a round trip
In an HTTPS (TLS 1.3) connection, before communication starts, the connecting side and the server agree on a method for exchanging encryption keys. The connecting side guesses a method the server "probably supports" and sends the key material for it up front. If the guess is wrong, the server asks it to choose again, adding one more round trip. This request to choose again is the HelloRetryRequest.
According to Cloudflare's blog, Cloudflare is dropping this guesswork on connections from its CDN to each origin server and switching to an approach that measures which methods each origin supports and uses one of them from the start (Automatic Key Exchange). Cloudflare says that with this rollout, the HelloRetryRequest rate fell from about 52% to 3.7%, and the time taken by connection handshakes at p90 was cut by more than 150 milliseconds. This covers connections on the scale of 45 billion per day. In addition, among origin connections secured with post-quantum cryptography, the share completed in a single round trip without choosing again rose from 0% to 99.2%. However, only 12.8% of all origins are said to support post-quantum key exchange.
In other words, once the CDN started measuring and aiming for the right method, it turned out that about half of connections had been spending an extra round trip.
Your own measurements cannot isolate that segment
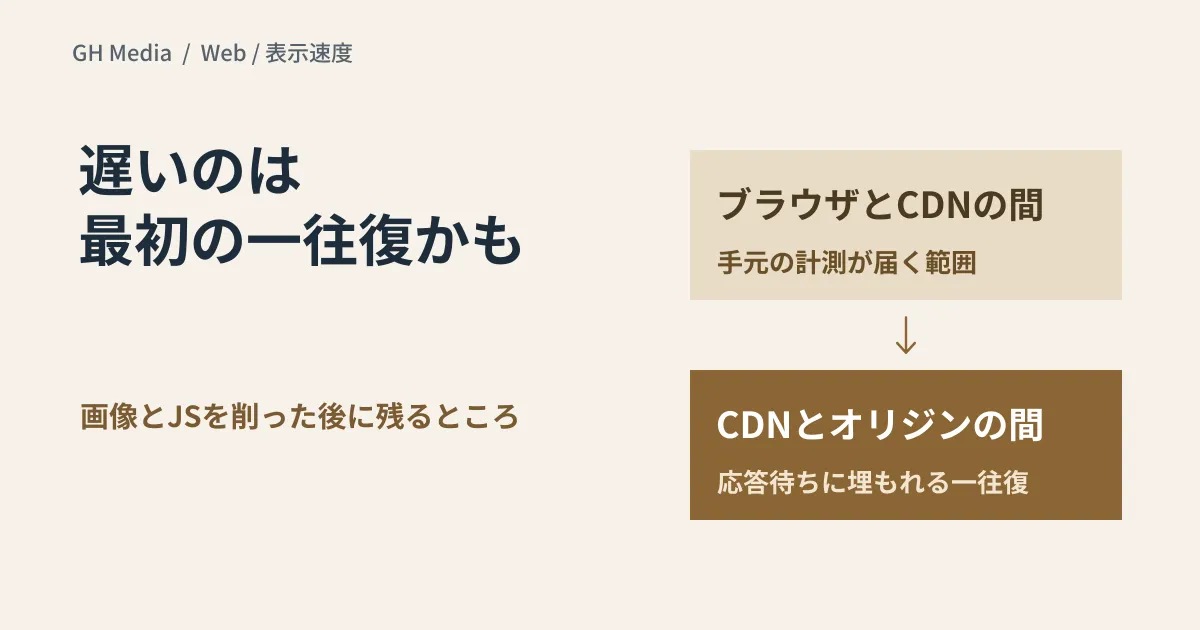
What matters here is not the size of the numbers but "which segment they measure." In the measurements site developers usually look at, the part broken down stage by stage is the segment from the browser to the nearest CDN. The round trip from the CDN to the origin server is lumped into the "waiting for a response" time while the CDN fetches from the origin, and cannot be seen separately.
| Segment | Common measurement tools | Main causes when slow |
|---|---|---|
| Browser → CDN | Lighthouse, browser developer tools | Images, JavaScript, rendering |
| CDN → origin | Included in the response wait in the tools above; cannot be separated | Connection setup, origin response time |
| Inside the origin | Server logs, APM | Application processing, database |

If you have exhausted frontend optimization and the site still does not feel faster, suspect the bottom two rows. If you want to check measures that cut JavaScript first, see deciding to ship less JavaScript.
Measure connection time on its own
Rather than a score for the whole site, measuring only the connection stages, separately, helps you isolate the cause. curl can output the elapsed time for each stage of a connection, so you can record name resolution, TCP connection, TLS establishment and time to first byte separately.
curl -o /dev/null -s -w \
  'dns:%{time_namelookup} tcp:%{time_connect} tls:%{time_appconnect} ttfb:%{time_starttransfer} total:%{time_total}\n' \
  https://example.com/
The difference between tls and tcp is the time taken to establish TLS, and the difference between ttfb and tls is the time until the server starts responding. When you measure a URL that goes through a CDN, everything up to tls reflects the path between you and the CDN, while the connection between the CDN and the origin and the origin's processing are lumped together in the difference between ttfb and tls. So connect directly to the origin, for example by using --resolve to point the host name at the origin's IP address, take the same measurement and compare (if the origin refuses connections from anywhere other than the CDN, run it from an allowed location). Run it several times and see which difference is largest. If TLS establishment stands out on the direct connection, the issue is on the connection side; if what comes after stands out, it is on the application or database side. Certificate and renewal practices themselves can also be the cause, which we cover in shorter TLS certificate lifetimes and automatic renewal.
What to confirm in your maintenance contract
This improvement is the kind that takes effect automatically as a setting on Cloudflare's side. According to the official documentation, it is on by default for existing and new zones on all plans, and it applies when the encryption mode is Full, Full (strict) or similar and the connection to the origin uses TLS 1.3. Users do not have to rewrite anything. That is exactly why maintenance should look at more basic items.
Which route your site is delivered through (via a CDN or directly). When the origin's TLS settings (including whether it supports TLS 1.3) were last reviewed. Whether your measurements only cover how things look from the browser. If you get a quote for speed improvements without being able to answer these three, you may end up spending effort where it will not help. We outline the approach of fixing things through ongoing upkeep rather than rework in keeping budget for improvements after launch.
On September 24, 2026, we rechecked Cloudflare's blog, its SSL/TLS documentation and the curl manual, using the excerpts of each page included in search results. The figures are aggregates across Cloudflare, not the improvement for any individual site. We have not measured handshake times in our own environment or compared Cloudflare settings. This article organizes the steps for isolating the cause and the items to check.
For investigating your site's display speed or reviewing your delivery setup, please consult GleamHub.