

"This period, which products are growing, and with which customers?" If chat could answer that question, monthly aggregation work would shrink considerably. In fact, features that do exactly this arrived in quick succession in September 2026.
On 10 September, AWS announced a feature in its BI service Amazon Quick that builds custom applications for analyzing and displaying data from natural language instructions alone. The app-building feature has been available to Plus, Professional and Enterprise users since 1 September. On the same day, 10 September, OpenAI added a "Data agent" to ChatGPT Work. It connects to internal data, takes analysis instructions through chat exchanges, and can even produce interactive dashboards.
Look at what they can connect to and the two are very similar: Redshift, BigQuery, Snowflake, Databricks, MongoDB, ClickHouse, Salesforce, and files on Google Drive or SharePoint. In other words, the premise is that the data on the other end is in order.
Companies that roll this out and get no answers get stuck right here.
What gets stuck is the data, not the tool
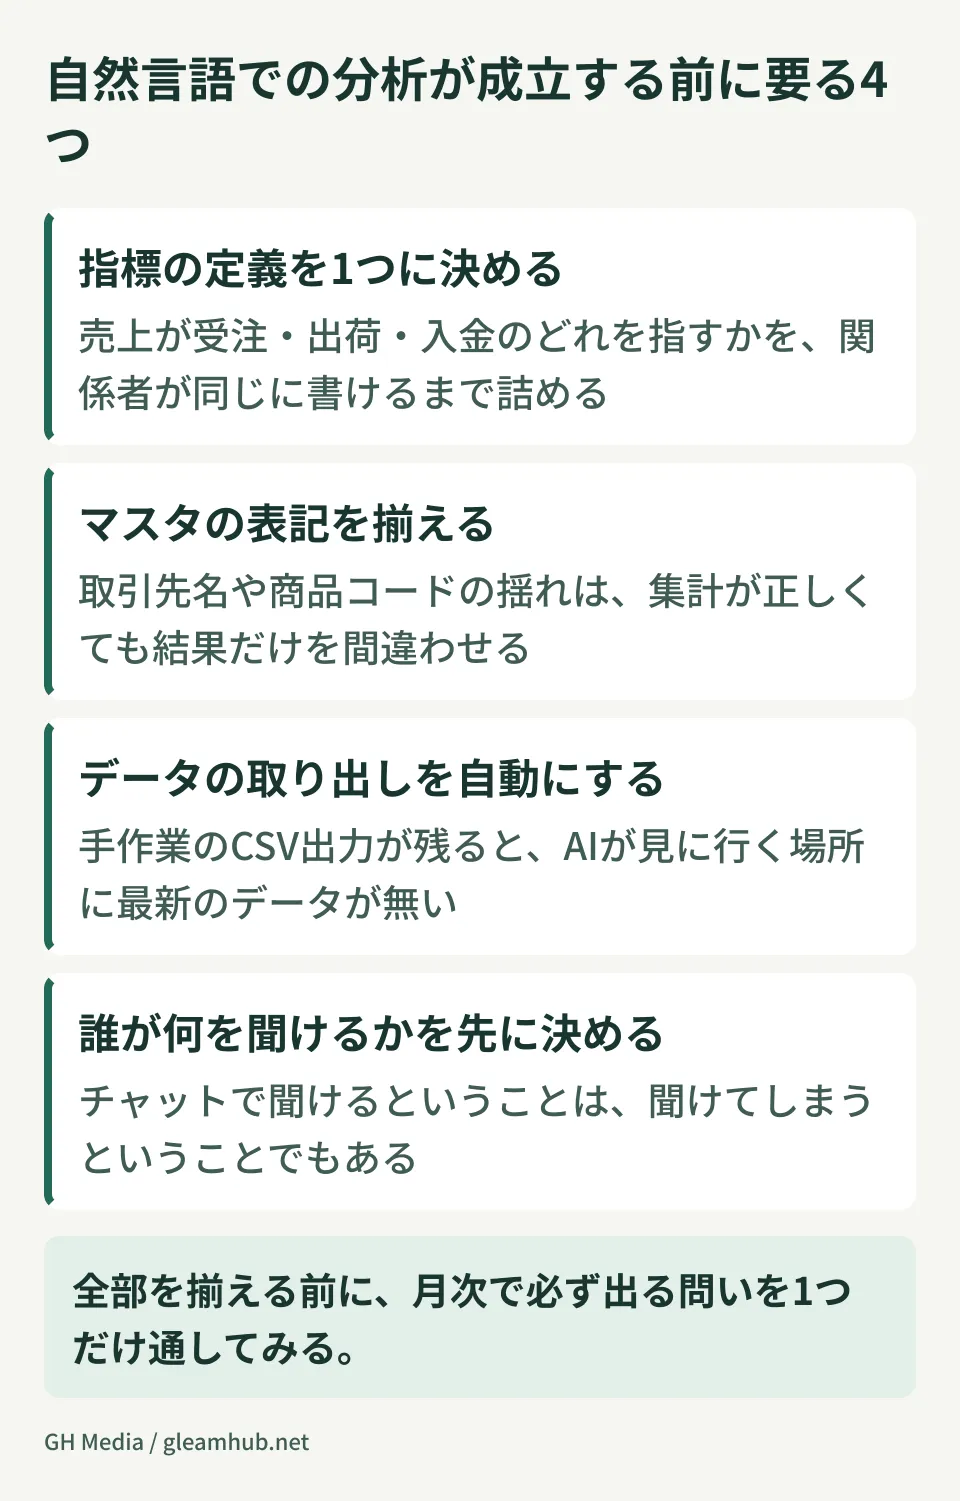
When a small or midsize company actually tries to introduce a BI you can query in natural language, the places it stalls fall into roughly four groups.
1. The same word means different things in different departments
Companies where "revenue" means three different things are not unusual: order basis, shipment basis, payment-received basis. Sales talks in orders, accounting talks in payments received. Both are correct, but ask an AI "what is revenue this month" and it answers with the definition in the table it is connected to. The worst outcome is when the answer comes back and it becomes a meeting document without anyone checking "which basis is that number."
No matter how clever the tool gets, this ambiguity does not resolve itself. Deciding the definition is the business side's job.
2. Master data is inconsistent
The same client is registered as "ABC Inc.," "ABC, Inc." and "ABC." Product codes were renumbered partway through a fiscal year. This is a hard-to-spot kind of breakage in which the aggregation runs correctly and only the result is wrong.
With natural language questions, this kind of breakage becomes even harder to see. In a situation where writing SQL would make you notice that "the row count does not add up," a chat answer comes back as confident prose. How to align master data is exactly the ground covered in designing shared meaning for business data.
3. Data extraction is still manual
Every month someone manually exports a CSV from the core system, works on it in Excel and drops it in a shared folder. While that practice remains, the latest data is not where the AI can go and look. You end up in a state where last month's data does not exist for the first few days of the month.
To get it into a form you can specify as a connector, you need to automate the regular extraction. This is not about building a large-scale platform; it is about getting one piece of data into a state where it lands in a fixed place at a fixed time.
4. Permissions have not been decided
Should anyone be able to ask about company-wide revenue? What about salaries or costs? Being able to ask in chat also means being able to find out. Until now, the physical wall of "you cannot see that number without system permissions" did the work of an effective rule. Consolidate the entry point for analysis and that wall disappears.
Before you roll this out, decide "who can ask" for each type of data. Narrowing it down later is harder once people have already seen it.
Look at the list of connectors and count how many you actually have
Look again at the connectors both services list: Redshift, BigQuery, Snowflake, Databricks, MongoDB, ClickHouse. These are names aimed at companies that already have a data platform.
At a company of a few dozen employees, it is uncommon to have anything on that list. In reality the data lives in accounting software, a sales management system, spreadsheets, and Excel files on someone's PC. You start from a state where there is nothing to put in the connector field.
That said, both services have a route for handling files directly: files on Google Drive, SharePoint or OneDrive, and CSV or Excel placed in S3. In other words, simply "putting it in a fixed place, in a fixed format, at a fixed time" is enough to serve as an entry point. Building that first is faster than standing up a new database, and easier to throw away if it does not work out.
The limits of using a spreadsheet as a shared storage location, and the options once you pass them, are laid out in how small and midsize companies should choose where to keep their data. You do not need to pick a full-scale platform from the start, but do hold to one practice from the beginning: once you decide where data lives, do not put it anywhere else. The moment there are two locations, the work of a human deciding which one is correct comes back.
Where to start
Getting everything in order before you start is not realistic. The faster way is to narrow to a single question and build only the state that can answer that question.
- Pick one question that always comes up in the monthly meeting. Numbers someone assembles by hand every time, such as "last month's gross margin by product," are good candidates
- Write the definition of that number on one page. Which basis, what range it includes, as of when. Work it out until three of the people involved would write the same thing
- Get only the data that number needs into a state where it is placed regularly. You do not need to integrate every system
- Test whether it can answer that one question. Once it can, add one more question
Proceed in this order and, even if you stop partway, you are left with "one number whose definition is settled." Compared with building the platform first and then looking for a use for it, the advantage is that the loss is small if it fails.
One more thing: the failure mode where building a dashboard becomes the goal in itself may well increase now that dashboards can be built in natural language. The perspectives laid out in what to decide before you build and what and how much to look at with a BI tool still apply even when the input method changes to chat. The easier "being able to build" becomes, the more weight "what am I looking at this for" carries.
What to do next
First, open one page of material from your most recent management meeting and trace where the numbers on it come from. If a person is producing them in Excel, that step is a candidate for automation as it stands.
Then ask the people involved, individually, for the definition of that number. If the answers diverge, you have found something that needs to be settled before you bring in a tool.
At GleamHub, we handle consultations on organizing internal data and taking stock of definitions, automating data extraction from core systems, and shaping it into a form usable for analysis, through our development, AI and automation advisory services. Because the approach depends on the systems you use and how you hold your data, please get in touch via Contact.
Sources
- Amazon Quick now supports building custom applications in natural language — AWS What's New
- AWS makes it possible to build data analysis apps in natural language with a new Amazon Quick feature — Publickey
- ChatGPT Work's "Data agent" analyzes internal data and builds charts and dashboards just by asking — ITmedia AI+
- OpenAI introduces the Data agent for ChatGPT Work — analyze enterprise data in natural language and create dashboards — gihyo.jp


