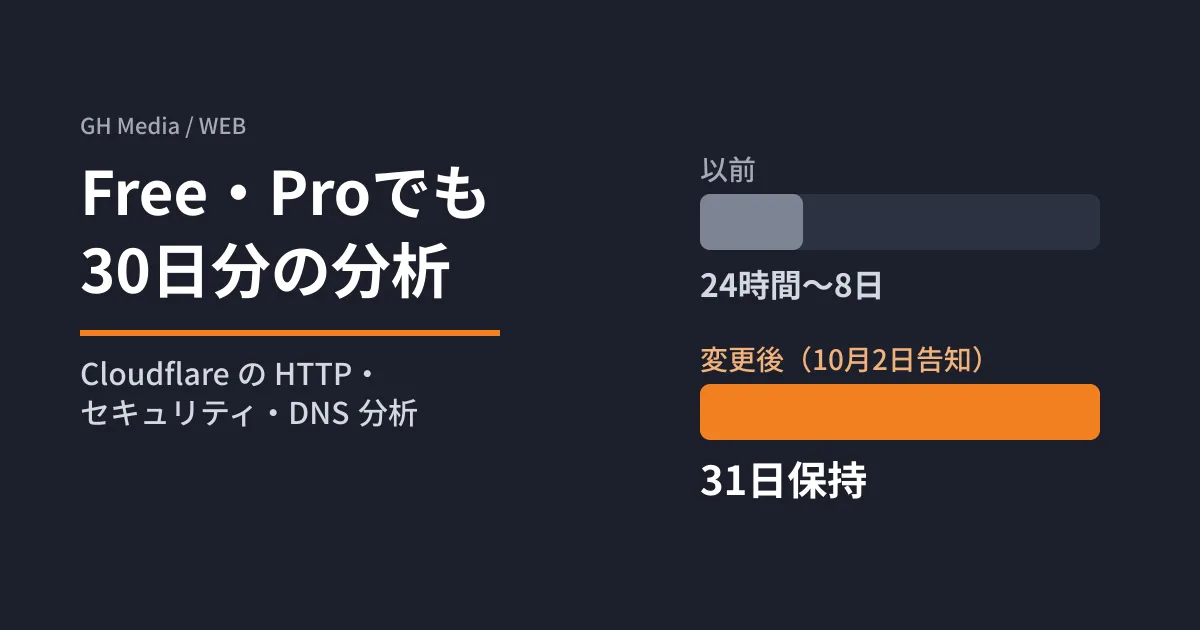
Contact form submissions suddenly spiked just last week. There were also reports that the site was briefly slow. You open Cloudflare's analytics to investigate, but on the free plan you can only go back a few days, and you end up unable to confirm the cause. On Free and Pro domains, you could previously look back only 24 hours to 8 days, depending on the dataset.
In its October 2, 2026 changelog, Cloudflare announced that at least 30 days of analytics data is now available on every plan. We read the changelog, the GraphQL API limits, and the per-plan table for security analytics in Cloudflare's documentation repository, and outline what you can now see.
What now covers 30 days
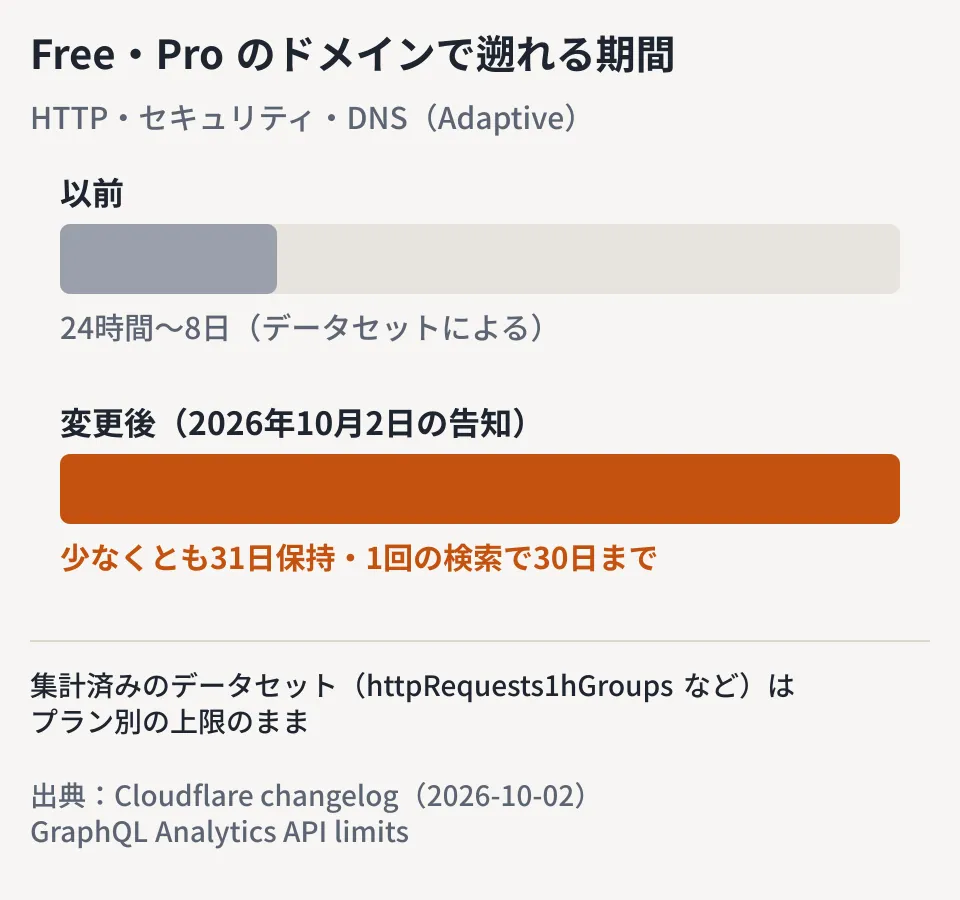
According to the changelog, the change applies to a type of dataset called "Adaptive." This includes HTTP requests, security events, and DNS analytics. Even Free and Pro domains retain at least 31 days, and a single query can cover up to 30 days. Previously, this ranged from 24 hours to 8 days, depending on the dataset.
This change applies to the Cloudflare dashboard, Custom Dashboards, and the GraphQL Analytics API alike. However, the datasets and fields available on each plan do not change. Pre-aggregated datasets such as httpRequests1hGroups keep their existing per-plan limits.
The security analytics documentation also includes a per-plan table.
| Free | Pro | Business | Enterprise | |
|---|---|---|---|---|
| Security Analytics retention period | 31 days | 31 days | 31 days | 90 days |
| Security Analytics range per query | 30 days | 30 days | 31 days | 31 days |
| Security Events retention period | 31 days | 31 days | 31 days | 31 days |
| Security Events range per query | 30 days | 30 days | 30 days | 31 days |
The Security Analytics documentation also states that account-level analytics are available only on Business and Enterprise domain plans. On Free and Pro, you view analytics on each domain's screen.
The dashboard location has also changed
In the dashboard, domain analytics are now consolidated in one place. Select a domain and open "Analytics" to see Traffic, Performance, Security, Cache, Origin, DNS, and Visitors as tabs, with the time range and filters shared across tabs. Account-level analytics are under "Analytics" in "Observability."
What you can now look back on for site maintenance
From here on is the editorial team's analysis based on the uses listed in the changelog. The editorial team has not checked this on a real zone's dashboard.
- Investigate after the fact. When a spike in inquiries or slow loading is reported, you can check requests and security events from several days earlier
- Compare the same day of the week. Put today side by side with the same day of the previous week to tell normal fluctuations from anomalies
- Separate one-off spikes from ongoing trends. With a month of data, you can tell whether an increase happened only on a specific day or is a gradual, continuing change
Web analytics tools such as GA4 collect data from tags that run on the page. Cloudflare analytics count requests that pass through Cloudflare. Because they count differently, it is not in itself abnormal for the two sets of numbers not to match. We outline which to use for what in our article on deciding where analytics should live. For traffic missed by measurement due to ad blockers and similar tools, our article on estimating measurement gaps is also helpful.
Check the limits for your own zone
The documentation advises checking the exact retention period and query range for each dataset with settings in the GraphQL API. notOlderThan is how many seconds back you can go, and maxDuration is the width of the time range you can specify in a single query.
query ($zoneTag: string) {
  viewer {
    zones(filter: { zoneTag: $zoneTag }) {
      settings {
        httpRequestsAdaptiveGroups { enabled notOlderThan maxDuration }
        firewallEventsAdaptive { enabled notOlderThan maxDuration }
      }
    }
  }
}
31 days is 2,678,400 seconds. The editorial team has not run this query against a real zone.
Pitfall
- Assuming every number is now 30 days. Pre-aggregated datasets and fields not available on your plan remain unchanged
- Assuming you no longer need monthly records because you have 31 days. Retention is "at least 31 days." If you want to compare with the same month last year, you need a separate practice of exporting and keeping the numbers each month
- Confusing it with Web Analytics. This change covers the HTTP, security, and DNS datasets, and the changelog does not mention Web Analytics (a feature that adds a measurement script to pages). Cases where that script is inserted automatically are covered in our article on the JS added after a nameserver transfer
On October 3, 2026, we directly opened and cross-checked the relevant parts of the changelog entry "30 days of analytics data on every plan" (2026-10-02), "GraphQL Analytics API limits," "Settings node," and the Security Analytics and Security Events documentation in the cloudflare/cloudflare-docs repository (commit 36706c5). On October 5, 2026, before publication, we confirmed the same content on the public pages at developers.cloudflare.com (changelog, GraphQL Analytics API limits, Security Analytics, Security Events). We have not checked the actual Cloudflare dashboard screens or query results.
For help setting up monitoring and maintenance for sites running on Cloudflare, contact us via website development and redesign consulting.
Sources
- 30 days of analytics data on every plan — Cloudflare changelog (cloudflare-docs)
- GraphQL Analytics API limits — Cloudflare docs (cloudflare-docs)
- Settings node — Cloudflare docs (cloudflare-docs)
- Security Analytics — Cloudflare docs (cloudflare-docs)
- Security Events — Cloudflare docs (cloudflare-docs)